
There are a lot of different ways to think about comparing two things, or more appropriately perhaps, two sets of things. If they are things we can count, we can easily see which there are more of. If they are more like a score, we can easily see which set has a higher score. We can also fairly easily see what the distribution of the things in each set are, although comparing the distributions is a bit more tricky.
Using some basic statistics measures, we can tell whether or not the two sets of things are different from each other using significance testing. This is typically done with a t-test or an analysis of variance (ANOVA) or a similar measure. These types of measures, based on the mean and variance of a set of data points, are simple and easy to calculate (especially with a basic stats program) and have therefore become commonplace in the research literature. But unfortunately, their simplicity ends up hiding a lot of information and potentially interesting nuance.
When performing a t-test, you need to (ahead of time) pick an appropriate cut-off point for acceptability. Basically, at what percent chance are you willing to say that these two sets are not different from each other. This number, usually set at 5%, is your alpha value (0.05) and your significance test result (the p value) must be lower than this to be accepted1. That’s all fine and good, but many people stop there when they find a significant2 result.
The problem with relying solely on a p value is that all it is is a very small hurdle that you have jumped over. One of my stats professors put it this way: you have defined a short hurdle with your alpha value and by passing the significance test, all you have done is jumped over that hurdle. It doesn’t matter if you jumped over it by a lot or missed it by a lot, because you were just trying to see whether or not you could jump over it. You have no other information about how much you jumped over it by (or how much you just missed it by); you only know whether or not you successfully made the jump. This is why the phrase “marginally significant” or “almost significant”, used when there’s a result of just over 0.05, drives me crazy. That is not what that test is telling you.
For instance, simply increasing sample size will give you a more “significant” p value. When you have a large N in your samples, a small difference in the means can become significant.
If you want to know how different those two sets of numbers are, not just whether they are different, you need something else: you need an effect size. And this is why effect size (or something similar) is an essential part of reporting results. It is much harder to hide statistically significant but fairly meaningless (because it’s really a very small effect) if you report an effect size in addition to your significance result.
Cohen’s d is one standardized effect size measure. The standardization allows you to use it to compare across different variables or studies, which if you’re doing a meta-analysis is essential. It is calculated by taking the difference in the means of the two samples and dividing by the pooled standard deviation.
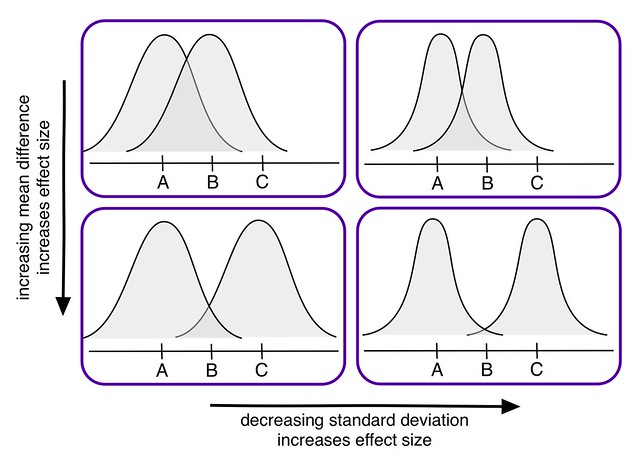
As you can see in this lovely diagram I made, there are two things that will directly influence your effect size: the mean difference in the samples and the standard deviations of the samples. This diagram is an oversimplification of course3, but I think it helps to illustrate the main idea. Effect size is really different to think about sometimes.
Pro tip: If you want your research to be included in a meta-analysis in the future, you should try to publish your results in a way that will make it easier for a future researcher to calculate an accurate effect size. The more assumptions other researchers have to make about your work, the less likely it will be to contribute to an overall understanding in your field (through a meta-analysis, at least).
If you are interested in using simulations for learning STEM in the classroom, I led a meta-analysis on that very topic. The final report came out earlier this year and I am currently working on an article about the results aimed at educators and developers. Long (and very technical) story short: simulations were associated with improved student understanding. There were lots of caveats and interesting tidbits, though, so you should read the full report if you’re interested.
- An alpha level of 5% means that if you pass that significance test, there is a 5% likelihood that this data occurred if your null hypothesis (the thing you’re trying to show is not the case) is true. So a low p value means that it is likely that your null hypothesis is not true. Is that confusing? Welcome to statistics! ↩
- NB: “Significant” means something different in statistics than in everyday life. How fun is that. ↩
- And also please pretend those are normal-shaped curves, I am just learning how to draw things like that on the computer. ↩
