
I have been on twitter for almost ten years. Twitter has changed a lot in that time and my enthusiasm for the platform has waned a bit over the years, but I still find it to be a compelling communication platform. Initially I used it to share about the more mundane, personal parts of life and my stresses as I finished graduate school. Lately it’s become more professionally-focused (most of the time) and more reflective of the many things that are happening in the world (but with important dog pictures also). I have met lots of people through twitter as well as listened and learned from thousands of people who I would never have met in my day-to-day life. It has helped me gain a wider audience for my academic work and has allowed me to share pictures of my awesome dog with strangers and friends alike.
I just hit 10,000 tweets (if I did this correctly then the tweet linking to this post would be number 10,000). And I thought it would be a good opportunity for me to go back through my twitter archive and get a sense of what all of those tweets were about and how I tweeted. (The analysis that follows is actually only on my first 9,945 tweets because I had to request my tweets a couple weeks ago and do the actual analysis.) This was also a fun R exercise for me1.
First, some overall numbers.
– Most tweets ever in a day (includes retweets): 35 (This was one of the days of the 2015 Learning @ Scale conference. The second highest was a DRK-12 PI meeting.)
– Number of references to my dog Laika: 173
– Number of tweets that contain an exclamation mark: 2429
– Number of tweets that are about coffee: 112
– Number of tweets that are retweets: 2654
– Number of academic conference tweets (AERA + ICLS + CSCL + NARST + L@S + DRK12 + Cyberlearning + GLS): 697
I tweet a good amount during conferences, so I was a bit surprised that those tweets make up a relatively small percentage of my overall tweets. Although the favorite/like and retweet data was not included in the data dump from Twitter, I do know that these conference tweets are usually my more popular ones. Nearly all of my “tweet a lot” days are during academic conferences. Some notable exceptions to this were the 2017 Women’s March in DC, the day I live-tweeted being snowed in during the big “Snowzilla” blizzard of January 2016, and a very tense USA World Cup match in 2014.
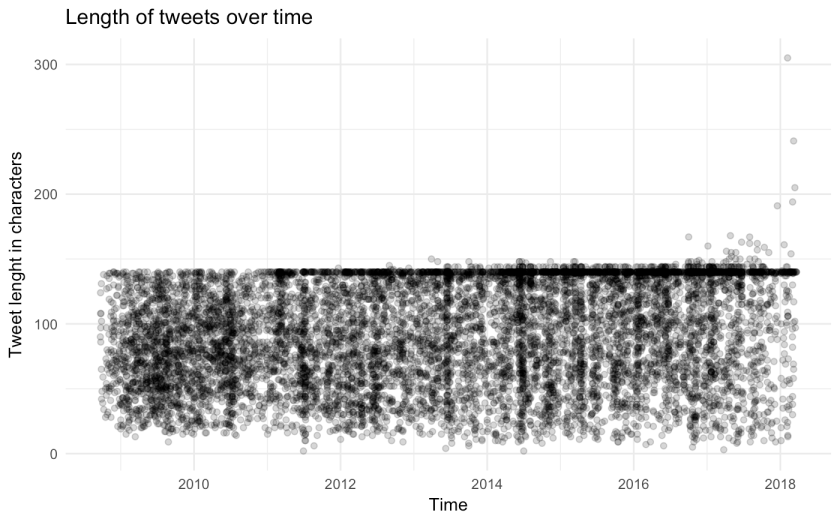
Another obvious metric to look at for tweets is length. Until recently, tweets were capped at 140 characters. In the graph below you can see that not only have I only rarely gone over that to use the full power of 280 characters that are now available, but also that it seems like many of my tweets were over 140 characters (that dark line that is formed by so many overlapping tweet data points) even before this recent change. And that has to do with two things: the change in how retweets happen and also how Twitter exported this tweet data. So back in the early days of twitter, if you wanted to retweet someone else’s tweet you had to do a “manual” retweet: copy their tweet and then append “RT @username” at the beginning. This sometimes required you to shorten the tweet (and so occasionally people would use “MT” instead of “RT” to denote that they modified the tweet) which was kind of a pain. Eventually Twitter evolved the service so that you could do officially retweets which show up entirely differently. The newer addition of quote tweeting (which is basically a retweet with your commentary attached and forefronted) also evolved this as well. When Twitter exported this data dump all of the official, automatic retweets were put into the form of the old manual retweets and therefore some of them are longer than the officially allowed 140 characters at the time.
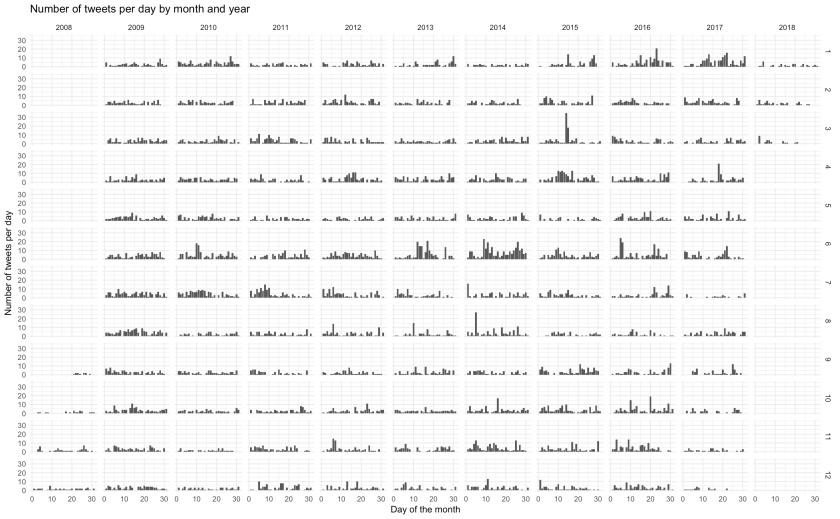
I also wanted to visualize all of my tweets across time. This graph shows the number of tweets per day, faceted by month and year. This gives a good sense of what a more typical day looks like for posting to twitter and where the big spikes are. There are lots of spikes in June because I tend to have conferences then. The March 2015 event also very clearly sticks out as the highest number of tweets/day. December is pretty low volume overall.
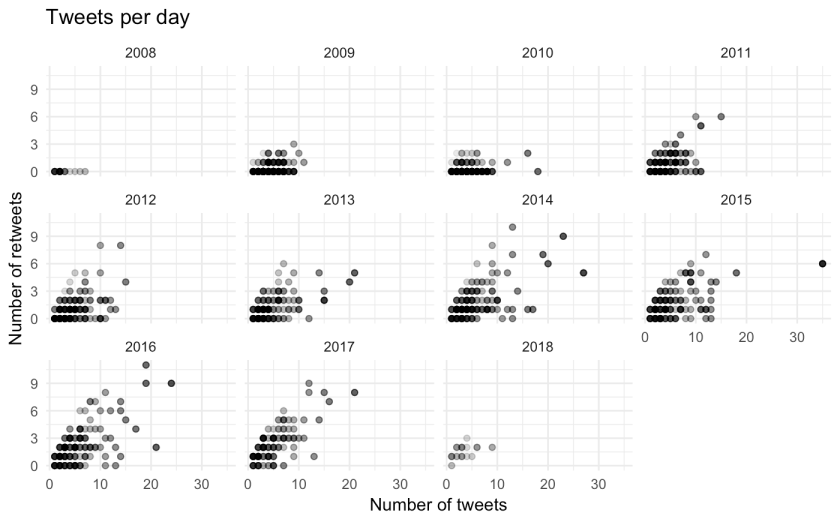
I also wanted to see if there was any relationship between how many tweets I retweeted per day and the overall number of tweets that day. This graph shows that there’s quite a spread and that there has been an interesting trend over time. My earlier tweeting days had fewer tweets/day and not too many retweets, generally farther away from the 1/1 imaginary line of all tweets that day being retweets. The later tweeting years, tend to have bursts of lots of tweets in one day, many of which are retweets.
Well, that’s it for now. Maybe later I will do a deeper-dive text analysis (using the tidytext R package) of the tweets.
- For more information on R and how great it is (in my opinion), start with my intro to R blog post. ↩
