These aren’t the search results you’re looking for

So I recently came across a really interesting real-life example of how generative AI can fail, especially in the case of using it as a search engine (which, as I’ll explain in more detail, it really shouldn’t ever be used as). I think this example can help highlight the real limitations of this technology and how we must be vigilant when using it (if you must).

A few months ago, my partner and I were in Los Angeles for Christmas. It was his first time there, so when we went to Hollywood to see a show at the Pantages, we spent a bit of time walking around the area to look at the stars on the Hollywood Walk of Fame. We found lots of notable ones and took a few pictures. I got really excited at one point because I found one that had Kenny Baker’s name on it.

If you are not a Star Wars nerd like me, then maybe this name doesn’t mean much to you, but R2-D2 is my favorite Star Wars character, and he was played by Kenny Baker for many of the movies.

I took a quick pic and we kept walking to get to our dinner reservation. While waiting for our food, I started going through my pictures and posted a couple to my Instagram stories. I was about to post the Kenny Baker one, but something caught my eye that didn’t seem quite right so I decided to wait and double check something.

photo of a Hollywood Walk of Fame star for Kenny Baker

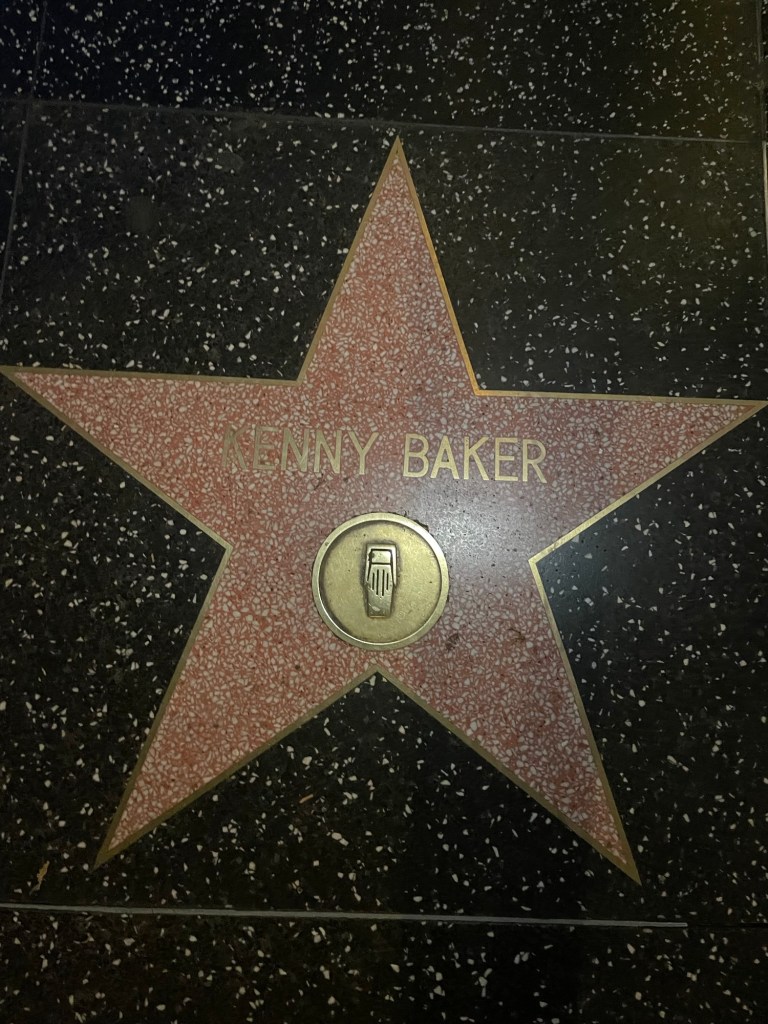
As you can see in the pic above, each star has an icon on it, that shows what area of entertainment that person was known for. I expected to see a movie camera icon there for Kenny Baker, but as you can see, it is a microphone instead. So that was odd.

I first did a quick search on IMDB to see if there was more than one Kenny Baker. Sure enough, there are quite a few. I then decided to go directly to the Hollywood Walk of Fame’s website and look there to see which Kenny Baker this star is for. As it turns out, it is a star to commemorate the work of an early radio star who performed on the Jack Benny show.

While I was doing this, my partner did a Google search on his phone and asked it if R2-D2 had a star on the Hollywood Walk of Fame (HWoF). On his phone, an AI-generated result that showed up at the top of the search results to “help” summarize. It clearly said that “Yes, R2-D2 does have a star on the Hollywood Walk of Fame” and even provided a nice picture of R2-D2 next to a star.

screenshot of a Google search result with an AI Overview that says that "Yes, R2-D2 (the droid from Star Wars) does have a star on the Hollywood Walk of Fame. In fact, it's one o the fictional characters to have earned this recognition. The star was awarded in the category of Motion Pictures." There is a thumbnail image of a star ceremony next to it.
Google search result showing AI Overview, about whether or not R2-D2 has a star on the Hollywood Walk of Fame

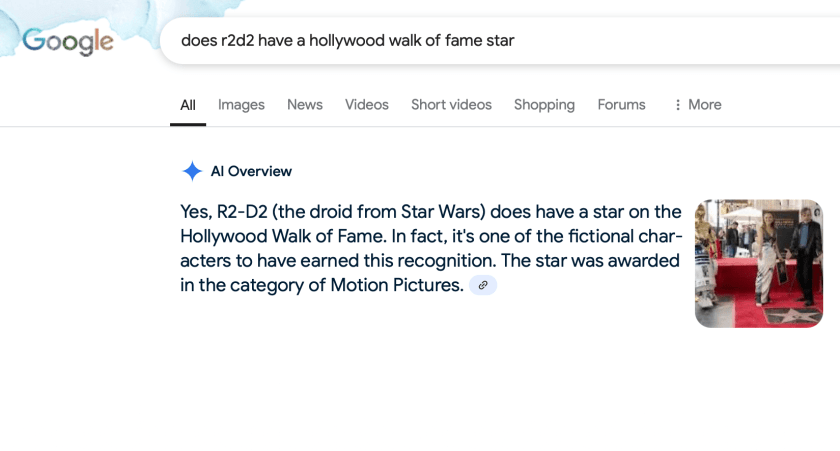
Unfortunately, this is wrong. And I think it’s wrong in a really interesting way, that can help us understand how this technology works and why it produced this incorrect result. On its face, this result seems plausible. R2-D2 is a beloved movie character from a huge franchise, so it makes sense that he1 (or rather, the person who played him) would have a star. Other people who acted in the Star Wars movies do have stars on the HWoF, including Mark Hamill, Carrie Fisher, and Harrison Ford. And R2-D2 is arguably the most important character in the Star Wars franchise2.

If you click on the link provided in the confident “AI Overview”, it takes you to a Wikipedia page of “fictional characters with stars” on the HWoF. Which R2-D2 is not on.

So, how did this incorrect result happen? Let’s first look at how this kind of technology works. These kinds of summarized results are outputs of generative AI, sometimes abbreviated as genAI. If you’ve heard of ChatGPT, it is one of these. It is based on a large language model (LLM), that has taken in vast amounts of text data, largely (and illegally, in a lot of cases) from internet sources. This includes Wikipedia, Reddit, and other online forums. LLMs take all of this data and then make a model of the likelihood of different words and phrases occurring together. Basically, you can think of it as a big table of numbers. How likely is one word going to follow another? It’s fancy predictive text. So for instance, if I type the word “movie”, there’s a decent chance that the following word is “character”, “plot”, or “screen” but a very low chance that it is “banana” or “easily”.

These LLMs also have information about structure and style. So it can understand that something is in a typical essay format versus a poem. One of the things it is good at is transforming one written genre into another (e.g., turn this paragraph into a Shakespearean sonnet). It can also turn a set of bullet points into a paragraph and vice versa or turn this paragraph into a haiku3.

But it’s also quite bad at a lot of things. And because it has one job, which is to generate text that sounds plausible, it will always do that, even if it’s not sure of the results or if there are no real results to be had. This ends up producing what is sometimes termed “hallucinations” or “slop”, where the LLM will make up things that sound plausible, because that is its job. For instance, if you’re working on an academic paper and you ask it to find some references on a certain topic, it will just make them up sometimes. The journal titles and paper titles will look plausible, but they don’t actually exist.

So, then, back to our R2-D2 example. How did this happen? Especially considering that the correct answer is actually in the source data on Wikipedia. I don’t know for sure, as I (or anyone else not working on these projects at these big tech companies) don’t have access to their models. But I have some ideas about how it decided to give this response. So, first there are a lot of associations between R2-D2 and the HWoF. For instance, there is that image (see above) that shows R2-D2 next to a star. It turns out that that was for the ceremony to celebrate Carrie Fisher’s star on the HWoF. (R2-D2 was also present when Mark Hamill received his star.) The training sets for LLMs include many things, including posts from Reddit, Wikipedia, and other publicly available information on the internet. There are lots of mentions on the internet of other actors from Star Wars being at HWoF events or getting their own stars. And there are of course lots of sentences in the LLM training sets that talk about R2-D2 with other Star Wars characters and actors. There is a Kenny Baker that has a star on the HWoF. And there are lots of sentences connecting (the name) Kenny Baker to R2-D2. And R2-D2 is in the Robot Hall of Fame. So, there is a clear connection. It is plausible.

But again, it is wrong. R2-D2 does not have a star on the Hollywood Walk of Fame. (And Kenny Baker, the actor who played him, does not either, just to be clear.) Lots and lots of connections make it seem like a plausible answer to the prompt. But it is wrong. LLMs are not doing a search, as we understand it, they are generating a plausible sounding answer.

You should only use this kind of technology if you are a content expert in the area. Otherwise you won’t be able to discern whether or not the information it’s giving is correct. So, this hopefully could help you decide which kinds of uses are appropriate for this technology and which are not. And to remember that that depends on who is using it and what they already know.

In addition to all of the above issues mentioned, it should be noted that LLMs and genAI in general, are also terrible for the environment. They require huge data centers and a large number of calculations to train their models and perform their predictive functions. This takes up an absurd amount of energy and water (to cool down the computers). Some estimates show that it takes 7-8x the amount of energy to run a ChatGPT query as it does to do a Google search. So, please reflect on this before using this technology and think about whether or not it’s worth destroying the planet over.

Remember, LLMs like ChatGPT and Google’s Gemini do not know anything. That is not the task they are performing. They are predicting likely text combinations based on a large corpus of what people have already said. That is all. They can’t do a search and cannot provide factual answers. The only person checking the accuracy of the output is you, the user, so you need to double check all of the information it gives you.

  1. Yes, R2-D2 officially has masculine personality programming.
  2. This point probably deserves its own blog post. But at the very least, George Lucas agrees with me.
  3. Knows form, style, and shape—
    Essay, poem, bullet point,
    Shifts with silent grace.

ISLS 2023

I’m chairing a session at #ISLS2023 (the annual meeting of the International Society of the Learning Sciences) next week, a short paper session in the Computer-Supported Collaborative Learning track. As of this morning, three of the four paper presenters, including one of my students, will be unable to be there in person due to delays in visa processing (the conference is in Montreal, Canada). I have heard from other attendees that this is not a problem isolated to this one session, but that large numbers of people have not gotten their visas yet.

An official tweet from the organizers said that “attendees who are unable to travel due to denied visas or personal hardships have been given the opportunity to send a video presentation or a digital poster. If you have this arrangement, please provide these materials as soon as possible.” Given the opportunity. Wow. That wording really says a lot to me. First of all, none of these people had “denied” visas. There are major delays in processing which is out of their control. Also, it makes it seem as if this option to pre-record a video and have me as the chair play it for them is an act of benevolence. Like, they should be so lucky for this option, when for many of them, being unable to attend this conference in person will be a huge missed opportunity for them professionally.

(The fact that this means that the in-person attendees will likely be over-representing privileged countries/backgrounds even more than usual is a slightly different rant for a different day.)

There is no real hybrid option for the conference this year. This was an intentional decision by the local organizing committee. There is a virtual participation option, but that was set up in a way so that those participants will not be able to attend regular paper sessions. The keynotes will be live-streamed and there is an online chat in Whova they can access. I think that’s about it.

When I told my student yesterday that he likely wouldn’t be able to Zoom in to our session he was (rightly) shocked. He attended another conference a few months ago and they (reportedly) had a very robust hybrid set-up, so it was a big surprise to him that it hadn’t been planned for this conference, which is of a similar size and has plenty of technology-focused researchers as members.

The first ICLS conference where I got a paper accepted was in 2008 and I and my co-authors were unable to attend for various reasons (cost, for me). We won the outstanding paper award that year and were also unable to accept that in person. We were allowed to record our presentation and have someone there locally show the video. At the time, this was a lovely accommodation and we were very grateful. It was a little strange knowing that over in Europe some people were watching our presentation and we couldn’t see their reactions or answer questions in real-time, but it was better than having to withdraw the paper. This now is the same option, a pre-recorded video, given to these presenters 15 years later. Due to advances in technology in those intervening 15 years, we do have the ability to have better options for remote participation and hybrid engagement, but those options were not taken this year.

This is not to say that designing for hybrid engagement is easy. It’s not. To do it well takes time and thought and money and people. And rushing it last-minute with inadequate or unknown resources (as I might try to do over the next few days for our session on Tuesday) does not usually end up with a satisfying or supportive environment. Also, it’s not fair to then basically put this extra labor and stress on to session chairs who will not be formally supported to do this if they even choose to do so.

Designing for wide engagement from a wide set of use cases and situations is good for everyone. If the organizers had planned for more robust hybrid engagement for those who a year ago we knew wouldn’t be able to attend, these folks now who are last-minute finding out they can’t go would be able to interact with those in-person in more meaningful ways.

Well, anyway, I have hope that in the following years we will avoid (or at least minimize) these kinds of issues due to more intentional and equitable design around hybrid engagement which is necessary to support our community long term. In addition to delays in visa processing, there are also many folks who are unable to attend these important meetings in person due to disability, family or child care responsibilities, the huge cost of traveling internationally, environmental concerns, or political/identity-related safety issues. There is a new sub-committee in ISLS that is focused on designing and supporting hybrid engagement for the annual meetings, and I’m happy and honored to be a part of that to work for sustainable change in how and who gets to participate in our learning sciences community. If you have any thoughts or ideas around this, please get in touch.

Trying out some ungrading

Even though we are still in the midst of a raging global pandemic and there’s tons of bad stuff happening, I decided nonetheless to make a substantial overhaul to my fall classes this semester. I guess we will see in time if this was a good decision or not.

I am trying out a variation on ungrading. My version will include additional reflection prompts and discussions with the students, to help them be more cognizant of their individual learning goals and how they are progressing toward them during the semester. We will check in at multiple times to see how they are progressing and see what kinds of additional or alternative supports they might need from me or fellow students. At the end of the semester, each student will make a written case to me about what grade they think they deserve and why and if it diverges greatly from my assessment of their learning, we will discuss it. If they are underselling their achievements, I will give them my higher grade; if they have an overblown idea of what they accomplished, we will have a chat (I don’t expect this to be a big issue, at least not with these students). Most students in these two classes usually get an A or A-, so I’m not overly concerned with this screwing things up too badly. The hope is that it will do two things: 1) reduce student anxiety and 2) have everyone focus more on how and what they are learning.

I got rid of all points associated with assignments in Canvas. This was the most nerve-wracking part for me. It finally felt real, even though I had been talking about it and thinking about it and planning around it for months. No points. The grade tab would be meaningless. 😳

I am teaching two graduate courses this semester, both of which I’ve taught multiple times. If I was teaching undergrads or a brand new course, I doubt I would be trying this out. Too many new things at once could be hard, and I feel like grad students are going to be easier to convince that this approach will work than undergrads (also, the undergrads I typically teach are in a teacher licensure program and they have a lot of specific requirements). This approach will probably end up taking up more time than what I used to do, but I think it will be a lot better. Grading always made me uncomfortable, and I feel like this approach is going to help me give better feedback to students and support them in better, more tailored ways.

I just finished teaching this first week and introducing the students to the concept of ungrading and walking them through the general plan. Some students seemed a bit puzzled when I talked about it and others were visibly excited (those folks seem to have recognized the term and had some familiarity with it). I think a lot of them are cautiously optimistic. For next week, they will each write up a summary of what their learning goals are for the course.

If you’re interested here’s the language I put in my syllabi around this:

I am trying out a non-traditional grading approach this semester, a variation on “Ungrading” (see Blum, 2020 for more on this). This is partly to relieve some anxiety around points and grades and also to help focus our attention on the process of learning rather than a particular letter grade. This might be in flux a little bit and your thoughts during the process would be helpful for tweaking it and making it successful for everyone. It will involve likely more effort on your part, mostly in the form of being more self-reflective about your learning throughout the semester. I will provide feedback on my observations of your learning as well as providing structure and opportunities for this reflection. Sometimes this feedback will be part of whole class discussions and sometimes it will be individualized. At any point during the semester, I would be happy to sit down and talk with you about how you feel you are progressing with the course content.

You are the person most responsible for your learning. My job as an instructor is to create and structure an environment that will facilitate this learning. I can’t do the learning for you and I also am not the person best suited to knowing whether or not you have really learned the material in a way that is consistent with your learning goals. Each of you are in this class for a different reason. The more that you can reflect on your progress toward your particular learning goals and communicate that to me, the more successful this class will be.

Learning will happen through your engagement in the class content, working on the assignments, and discussing the topics with your fellow classmates. Being fully present in class is an essential part of this process. The more you can be honest with yourself and your classmates about what you don’t understand or are struggling with conceptually, the better we will all be in terms of addressing those concerns together. Of course, not everyone will feel comfortable at first sharing with others in the class, but one of my goals is to create a learning environment in which you feel safe in openly talking about what and how you are learning and what you still need to understand.

What this will involve:

  • Reflection activities about your learning goals and progressing towards those (and perhaps editing them) throughout the semester
  • Self-evaluation of your major assignments and final project
  • At the end of the semester you will make a written case to me about what grade you think you deserve and why and I will compare that to my assessment of your learning. If there’s a big disagreement between our assessments, we will meet and discuss.

Finally, I’d like to thank the members of our little ungrading book club in the spring of 2022 for sharing your thoughts and concerns and ideas around this. The few of you who had already tried this gave me hope for trying this out.

Another Year of Pandemic Teaching

Well, we are doing this again. This past June, when we had a few weeks of almost-normalcy (at least for us vaccinated folks), I really didn’t think we’d be back here again facing another semester of masks and testing and uncertainty and worry. But here we are.

I am lucky because my university has been taking this pandemic seriously from the very beginning. I want to mention that specifically because I know that many other colleges and universities have not done this or have really leaned into ignoring the real and serious harms that can occur when this is not taken seriously. We have had on-demand saliva-based PCR testing available to us as often as we’ve wanted it for the past year. I go to campus, spit into a tube, and a few hours later get a result pushed to an app (and email). That alone was a huge help to me during the last year before I got vaccinated in order to give me some relief to my anxiety about covid.

For this fall semester, they have required everyone to be vaccinated, for which I am very grateful. We still have testing available and I will still go get tested every week (and will encourage my students to do the same), especially now that we’ll be back on campus a bit.

I have chosen to teach in person this semester (and yes, it was a choice, and again, I am lucky that I had this as a choice and that it was not forced on me like at other institutions). This was due to the current set of circumstances, which could change throughout the semester. First, I am teaching two graduate-level courses that are relatively small (10-15 students typically). I have taught them both before, both in-person and remote, and I feel strongly that the class is better when it is in person. It is also, frankly, easier for me to teach in person. Because I am vaccinated and everyone else should be vaccinated and we will all have to wear masks the whole time and I am bringing my portable HEPA filter with me, I feel like it is worth trying to doing this in person. (If I had small children at home who are unvaccinated or if it was a larger class of undergrads – like I’ll have in the spring – I might be making a different choice.) But I am also, in the back of my mind, making alternate plans in case things get worse in a few weeks or a month or two and we’ll have to transition back to remote. I think that’s definitely possible and it won’t be awesome and hopefully we won’t have to do that (for multiple reasons), but at least I know I can manage that and it will be fine.

It’s very strange seeing people back on campus. The calendar in my office is still on March 2020. The vibe seems to be hopeful but uncertain. At least, that’s how I feel. My dog is upset that I am not working from home every day anymore. But, like us, she will adapt.

Also, last fall I added a pandemic and coronavirus statement to my syllabi. I’m including it again this year and have copied it here in case you might find it helpful to adapt to your syllabus:

Pandemic and Coronavirus statement

We are attempting to have as normal of a semester as possible during a global pandemic. I think it is important to remember that this is happening in the background of our learning this semester. The pandemic will affect us all in different ways and at different points in time throughout the semester. It is crucial that we are kind and empathetic towards ourselves and each other during this time. We need to be flexible and adaptable and we need to center caring for each other.

I want to be very clear: your health and the health of your family, classmates, and your community is the most important thing. This includes both your physical and mental health. Please keep me updated with how you are doing and if you need extensions on due dates or other support. I don’t need any specifics about what is going on, I just need you to tell me what you need.

Try not to compare yourself to others; you don’t know what others are or are not going through (this is good advice even when we’re not trying to get through a pandemic).

Toward a more open science practice with R

Recently I did a webinar with my colleague Joshua Rosenberg, hosted by the Center for Open Science, on Analyzing Educational Data with Open Science Best Practices, R, and OSF. You can find a recording of the webinar here and our slides and an example R Notebook are in an OSF repository here. I thought I would do this blog post to summarize some of the main things I talked about there and highlight some of the more important aspects.

This webinar was ostensibly about open science for educational data. I think most of us want to engage in more open science practices (which could include open data, open materials, preregistration of studies, replication, posting preprints, and reporting null results) but don’t know necessarily where to begin or what tools to use. I think we tried to make the argument that workflows, procedures, practices, and behaviors that are good practice for you by yourself, future you, and your internal team can also be good for open science. And that using R and its many packages and tools is a good way of achieving those goals.

I’ve written many times before about how much I love using R and how I want others to incorporate it more into their practice. I’ve now collected the series of blog posts as well as other related blog posts (like this one!) and slides onto one page for easy access. You can go to cynthiadangelo.com/r/ to see all of the R related stuff that I have worked on linked in one place.

In general, I’ve been thinking a lot lately about my values and commitments as a researcher and how I approach my work in a very basic way. What is important to me, my collaborators, and my field? How could I be doing things differently or looking at my assumptions differently?

This thinking led me to this set of things to consider for a more open science approach:

  • There are a lot of technical tools and solutions to some of the open science problems. But there are also philosophical/ethical/moral issues to consider.
  • Humans are participants that helped produce your data. All humans deserve respect and so do their data.
  • There’s no easy answer for some of these situations you might face. That’s ok. Part of what open science asks is to consider your options and document your decision making.
  • Reflect early on in your process about what your goals are and how you want to achieve them. What are your values? How do these match up?

Some of the tips and guidelines that I talk about in the webinar: (1) Documentation is so important. It’s also really difficult. Making things clearer for you and your future self will also make them clearer for others who might eventually see your code. (2) A tidy data structure will make things easier for you and easier for others to understand. If you’re not already on board the tidyverse train, it’s never too late to start. (3) Make sure you have a data dictionary somewhere that explains all of your variables. This sounds obvious, but it doesn’t usually happen because in the moment you think you understand all of your variables. But future you will not remember all of those things. Write it down. Preferably in a R Notebook (more on that later). (4) Pick a consistent and clear file naming convention early on in your project (preferably before you begin data collection). Think about the date format you use and think about the unit of analysis you will care about later and try to incorporate it directly into your filename to help with filtering and analysis later on. (5) Of course I want you to visualize your data. Descriptive statistics can be misleading sometimes and visualization is an important step in your process and is not just an end product.

The thing that ties all of this together is using a R Notebook within RStudio. R Notebooks make use of RMarkdown, a flavor of Markdown, my favorite way to write. It is a plain text file, so it’s easy to version control and easy to share, both things that are hugely important when thinking about open science. I really like R Notebooks because you can easily incorporate explanatory text alongside your code and figures/graphs are persistent across the page so you can scroll and easily refer back to something above or below where you are working. This, in my opinion, is a much better way to use R than the older way with scripts and the console.

R Notebooks can produce an html file that you can send to your colleague or friend who doesn’t have R installed and they will be able to open it up in a browser and see all of your wonderful thoughts and figures. It’s really great. You can also execute code in Python or JavaScript or D3 (or a few other programming languages) in addition to R, so it’s very versatile. There are a lot of output formats as well, including pdf, Word, slide decks, dashboards, and books. And they are all customizable. Check out the RMarkdown website to see all of the options and more details on how they work. For me, they dramatically changed (in a good way) how I do my work.

Maybe a good question to leave you with is to try and answer “What is the best way for you to work toward open science?” It doesn’t have to be a big thing; it can be a bunch of small changes over time. This hopefully shouldn’t feel too overwhelming. There are lots of us here to help.

Teaching in the time of Coronavirus

Our spring semester ended a little bit ago and after having taught online for the second half of it and now planning for an online fall semester, I have some thoughts. First, a little bit about me and my position in all of this, so you can understand where my perspective is coming from. I am an assistant professor at a large public Midwestern university. I study learning and educational technologies. I am an old millennial and have seen first-hand how technology has dramatically changed during my schooling career (from early personal computers in elementary school to broadband internet in college to smart phones and social media now). I have a serious underlying medical condition (type 1 diabetes) that affects my everyday life in sometimes unpredictable ways and makes me much more vulnerable to adverse complications with Covid-19 but also has supplied me with coping mechanisms and resilience to deal with this physical distancing1 and uncertainty that we all now face. Alright, here are my thoughts on teaching (and just being in the world) in this time of crisis and how we can adapt and get through it safely.

Guiding principles during an uncertain time

My guiding principles around this transition to online were flexibility and empathy. Being flexible with myself in how I adapted the course and being ok with making changes week to week as we were figuring it out, and being flexible with my students in understanding what their needs were and how they were changing as the pandemic continued. Empathy is equally important because it’s more important than ever to create a supportive and nurturing classroom culture. And that is built on empathy and trust.

Continue reading “Teaching in the time of Coronavirus”

Data Visualization

This is the fourth part in an ongoing series on how and why you should be using R, especially if you are a social science researcher or education researcher, like me. If you missed the earlier ones, you can check out part 1 (Intro to R), part 2 (R Basics), and part 3 (Data Cleaning and Manipulation). This post will go into some more specifics relating to data visualization.

There are many ways to visualize your data using R. By far the most popular (and I think robust and flexible) is using the ggplot2 package. This post will talk a bit about why and how to visualize your data and some tips and basics to using R’s ggplot2 package to help you achieve your visualization goals.

Why visualize?

There are lots of reasons why you might want to visualize your data (or rather, why you should visualize your data). It can be a useful tool at various stages of research, and depending on where you are in your analysis process, different aspects of visualization might be more or less important to focus on. The way I see it, there are three main purposes for data visualization: examining your data, showing your data/findings, and sharing your data/findings.

What question are you trying to answer with your data? How can a visualization help you answer that? Do you have a really complex data set that is too hard to easily capture with a few numbers? Are you interested in variation and distribution rather than just means and medians? Are you exploring different relationships between variables and want to see how they interact?

Continue reading “Data Visualization”

Data Cleaning and Manipulation/Organization

This is the third part in an ongoing series on how and why you should be using R. If you missed the earlier ones, you can check out part 1 (Intro to R) and part 2 (R Basics). This post will go into some more specifics relating to data cleaning, organization, and manipulation.

In my opinion, the dplyr package is a game changer for those trying to learn R. It is what motivated me from just recommending that people use R to basically demanding that my friends and co-workers switch to R. I remember the day that I finally got around to learning how to use the package’s functionality and all of the ways in which it lets you easily and clearly manipulate your data frames1. I just kind of stared at my computer screen and imagined how much better my data-life was going to be with these tools. I realized that the hours and hours I used to spend in Excel trying to massage my data into the right form were over2. Also, I wouldn’t have to decipher weird R base code anymore when trying to create new variables or filter datasets. The dplyr package and its friends make your code/scripts much easier to read which will help both you and future you in trying to decipher what is going on.

Continue reading “Data Cleaning and Manipulation/Organization”

Back to academia!

In August I moved across the country (again) for a new opportunity that I am so excited about. I have started a new position as a tenure-track assistant professor at the University of Illinois at Urbana-Champaign. Yay! I am part of a new campus-level initiative called Technology Innovation in Educational Research and Design (or TIER-ED). I have a split appointment within the College of Education; I have a 75% appointment in the Educational Psychology department and 25% in the Curriculum and Instruction department. The plan is to do a lot of interdisciplinary work across campus (e.g., with VR/AR researchers, speech researchers, and the physics department).

img_5392

Continue reading “Back to academia!”

10,000 Tweets

I have been on twitter for almost ten years. Twitter has changed a lot in that time and my enthusiasm for the platform has waned a bit over the years, but I still find it to be a compelling communication platform. Initially I used it to share about the more mundane, personal parts of life and my stresses as I finished graduate school. Lately it’s become more professionally-focused (most of the time) and more reflective of the many things that are happening in the world (but with important dog pictures also). I have met lots of people through twitter as well as listened and learned from thousands of people who I would never have met in my day-to-day life. It has helped me gain a wider audience for my academic work and has allowed me to share pictures of my awesome dog with strangers and friends alike.

I just hit 10,000 tweets (if I did this correctly then the tweet linking to this post would be number 10,000). And I thought it would be a good opportunity for me to go back through my twitter archive and get a sense of what all of those tweets were about and how I tweeted. (The analysis that follows is actually only on my first 9,945 tweets because I had to request my tweets a couple weeks ago and do the actual analysis.) This was also a fun R exercise for me1.

Continue reading “10,000 Tweets”